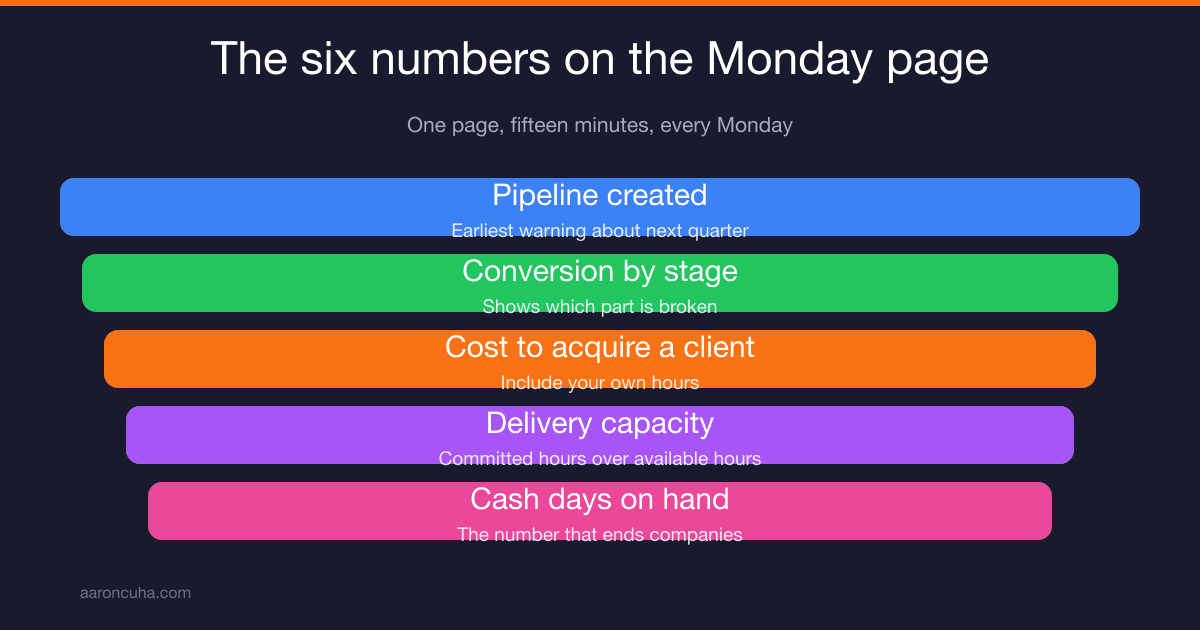
I ran 280 offices and 3,000 employees while watching the wrong business dashboard metrics. The 2008 collapse taught me which six numbers warn you months in advance. Here is the one page Monday review that takes fifteen minutes.
I ran 280 offices and 3,000 employees. I read reports every week. I still missed the collapse coming, because I was watching the wrong business dashboard metrics at the wrong time.
Key Takeaways
- Track six business dashboard metrics weekly, not sixty reports monthly.
- Pipeline created warns you months before revenue does.
- Every metric needs a threshold and a pre-decided action.
- Cash days on hand is the number that ends companies.
- Revenue goes last on the page, not first.
If your current reporting takes an hour and changes nothing, you do not have a dashboard. You have a comfort blanket. Start with a Channel Audit and Plan and see which numbers are actually driving your growth.
The Numbers I Ignored Before 280 Offices Collapsed
I watched revenue and headcount. Both looked strong right up until they did not. The numbers that were already screaming, demand entering the funnel and cash runway, sat buried in reports I skimmed.
At DirectLender we had scale. Offices across the country. Thousands of employees. A reporting stack that produced more paper than any human could read in a week.
That was the problem. Volume of reporting is not the same as clarity. I had every number and no signal.
Here is what actually happened. New qualified demand started thinning first. Then conversion got harder and slower. Then the cost to win each client crept up. Revenue kept posting fine for a while because we were closing deals that entered the funnel months earlier.
Revenue is a rear view mirror. By the time it turns, the turn happened long ago.
I spent the decade after that doing humanitarian work in Nepal, and I thought about this constantly. Not the market. Not the crash. The fact that the warning was in my own data and I did not have a system that forced me to look at it.
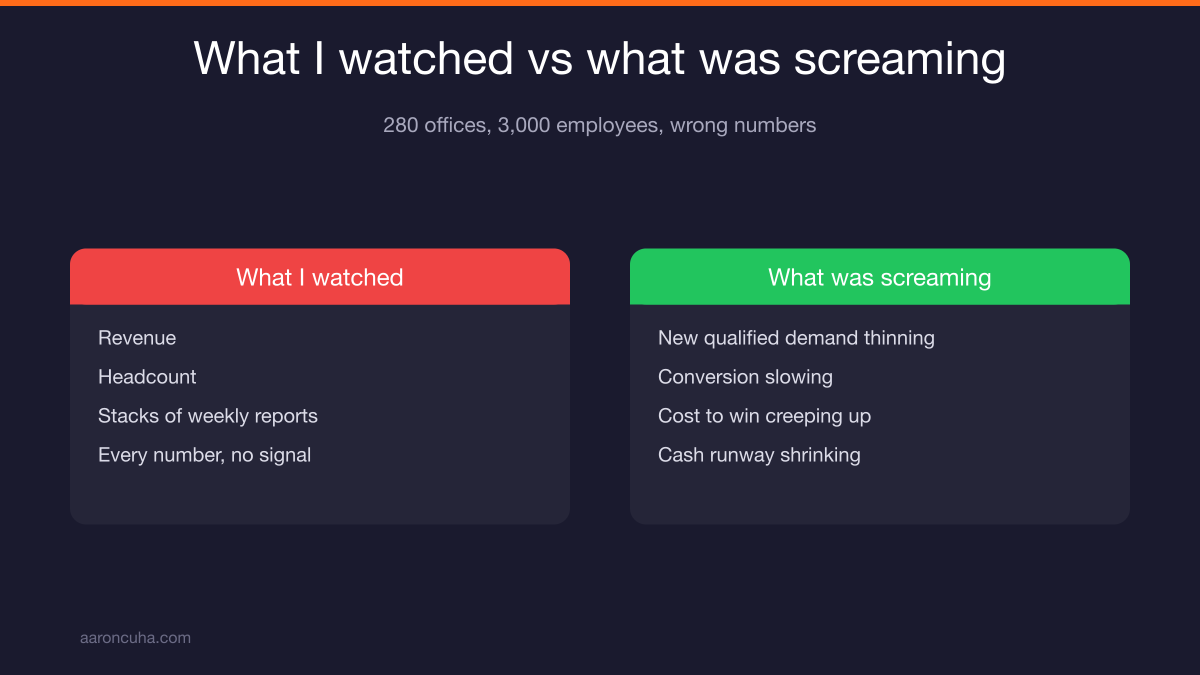
So I built one. Six numbers. One page. Fifteen minutes every Monday.
What Business Dashboard Metrics Actually Are
Business dashboard metrics are a short, fixed list of numbers you review on a set cadence, where each number is tied to a specific decision you will make if it crosses a threshold.
That last part matters most. A number without a decision attached is trivia.
Most owners I coach have reporting. What they do not have is a review. They pull data, feel a feeling about it, and go back to work. Nothing changes.
A real dashboard does three things:
- Limits what you look at so you actually look
- Sets a threshold so you know when a number is a problem
- Names the action before you are emotional about it
The pre-decided action is the whole trick. When pipeline drops, you do not sit and worry. You run the outbound sprint you wrote down three months ago on a calm Tuesday.
This is the same principle behind my Systems Over Hustle framework. Decisions made in advance beat decisions made under pressure, every single time.
Why Six Numbers Beat Sixty Reports
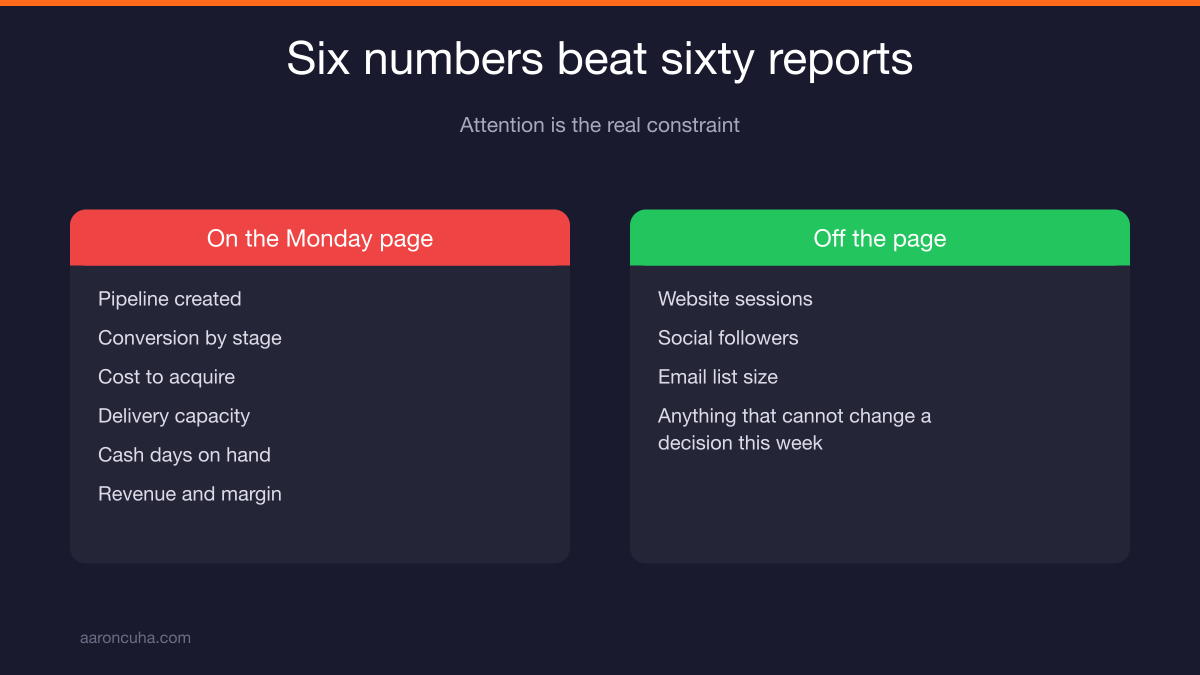
You will read six numbers every week for years. You will not read sixty. A dashboard you actually use beats a dashboard that is complete.
Attention is the real constraint in a small business. Not data. Not tools. You have maybe fifteen good minutes on a Monday before the day grabs you.

So here is the filter I use, and I would apply it hard:
If a number cannot change a decision this week, it comes off the page.
Website sessions? Off, unless you are running a specific traffic test. Social followers? Off. Email list size? Off. These are interesting. They are not steering.
They can live in a monthly or quarterly review. The Monday page is for what moves.
Six is not magic. It is just about the most a human can scan, compare against last week, and act on before losing focus. Five works. Eight starts to blur.
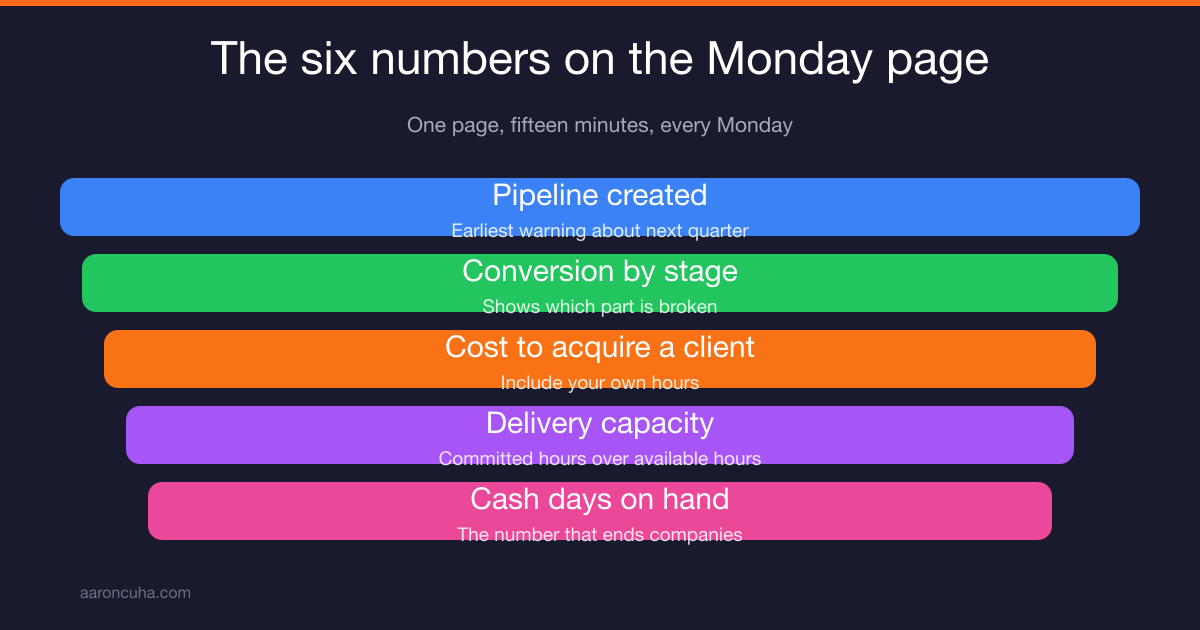
The six I use cover the full arc of a business: demand in, conversion through, cost of getting it, ability to deliver it, cash to survive it, and revenue to score it.
Number 1: Pipeline Created
Pipeline created is the count of new qualified opportunities that entered your funnel this week. It is the earliest honest warning you will ever get about next quarter.
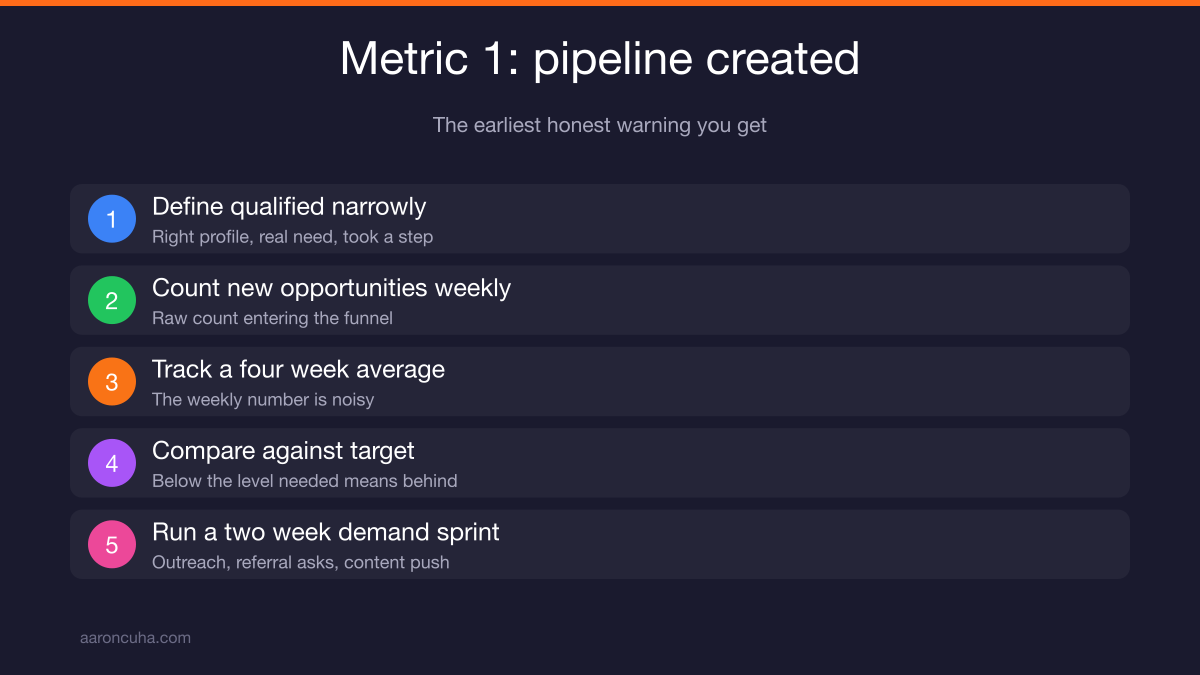
Define qualified narrowly. Not everyone who downloaded something. Someone who fits your client profile, has a real need, and has taken a step toward you.
Track it as a raw weekly count plus a rolling four week average. The weekly number is noisy. The rolling average is the truth.
The threshold: when your four week rolling average drops below the level required to hit your revenue target at your current conversion rate, you are already behind. Not soon. Already.
Because deals take time to close, a soft pipeline week today shows up in revenue one full sales cycle from now. That gap is your whole advantage, if you are watching.
The action: a two week demand sprint. Direct outreach to your existing list, referral asks to recent clients, and a content push on the platform where your buyers actually search.
For most of the owners I work with, that content push is video. A single well targeted video keeps producing pipeline for years, which is exactly why I wrote Crazy Simple YouTube. Paid ads stop the moment you stop paying. A ranking video does not.
If you want the mechanics of turning views into qualified conversations, read my breakdown of a YouTube lead generation strategy that runs on a repeatable schedule.
Number 2: Conversion Rate By Stage
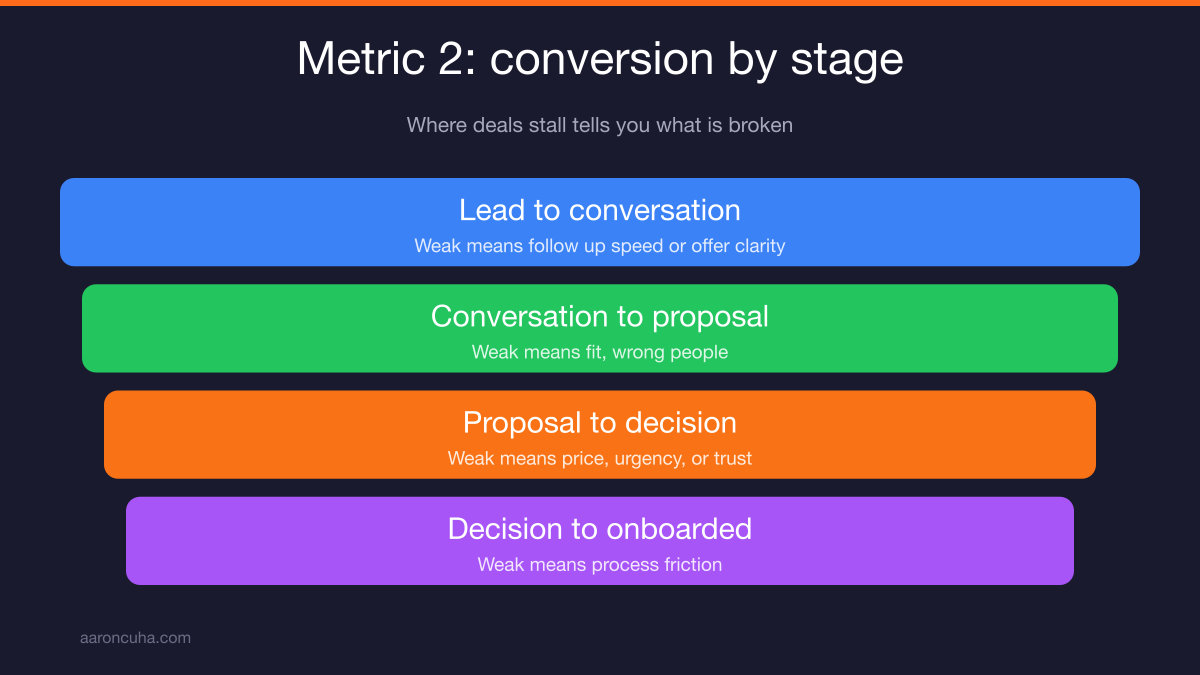
Do not track one blended conversion number. Track stage to stage. Where deals stall tells you exactly which part of your business is broken.
A blended rate tells you something is wrong. Stage conversion tells you what.
Use four stages minimum:
- Lead to conversation. Did they book and show up?
- Conversation to proposal. Did you earn the right to present?
- Proposal to decision. Did they say yes or no?
- Decision to onboarded. Did the money and paperwork actually clear?
Now read the diagnosis. Weak lead to conversation means your follow up speed or your offer clarity is off. Weak conversation to proposal usually means fit, meaning you are attracting the wrong people. Weak proposal to decision means price, urgency, or trust. Weak decision to onboarded means your process has friction nobody warned you about.
The action: audit the single worst stage, not all of them. Pull the last ten deals that died there and read the notes. Ten deals will tell you more than any dashboard.
Then fix one thing. Rewrite the follow up sequence, tighten the qualifying questions, or change the order of your proposal. One change, then watch the number for three weeks.
Fit problems almost always trace back upstream to who you are attracting. If your conversations feel like uphill work, the issue may be positioning, not skill. I cover that in how to pick a niche that actually pays.
Number 3: Cost to Acquire a Client
Total acquisition spend divided by clients won. Include your own time at a real hourly rate. Most owners skip that and get a number that lies to them.
Here is the honest version of the math. Add up ad spend, tools, contractor time, commissions, and the hours you personally put into selling. Price your hours at what you would pay someone to replace you. Divide by new clients.
Owners resist pricing their own time because it makes cheap channels look expensive. That is the point. Free is not free when it eats twenty hours a week.
Track it monthly on the Monday page as a rolling figure. Compare it against the average value of a client over their full relationship with you.
The threshold: when acquisition cost climbs for two consecutive months while conversion holds steady, your channel is getting more expensive, not your sales team getting worse.
The action: shift budget away from rented attention and toward owned assets. Search-ranking content, an email list, a book, a channel. Assets that keep working after you stop paying.
The U.S. Small Business Administration has solid free guidance on marketing budgeting if you want a baseline framework for allocating spend.
This is the argument for authority content in one sentence: paid acquisition cost tends to rise over time, owned acquisition cost tends to fall. I broke down the compounding effect in The Authority Flywheel.
Number 4: Delivery Capacity
Committed delivery hours divided by available delivery hours. This is the number that stops you from selling your way into a service disaster.
Growing businesses die from delivery failure more often than from lack of sales. You sell hard, you win, you cannot deliver, referrals dry up, reviews turn, and you are rebuilding from a worse position than before.
Calculate it simply. Add every hour committed to current clients over the next thirty days. Divide by the hours your team can actually deliver, not the hours on the payroll.

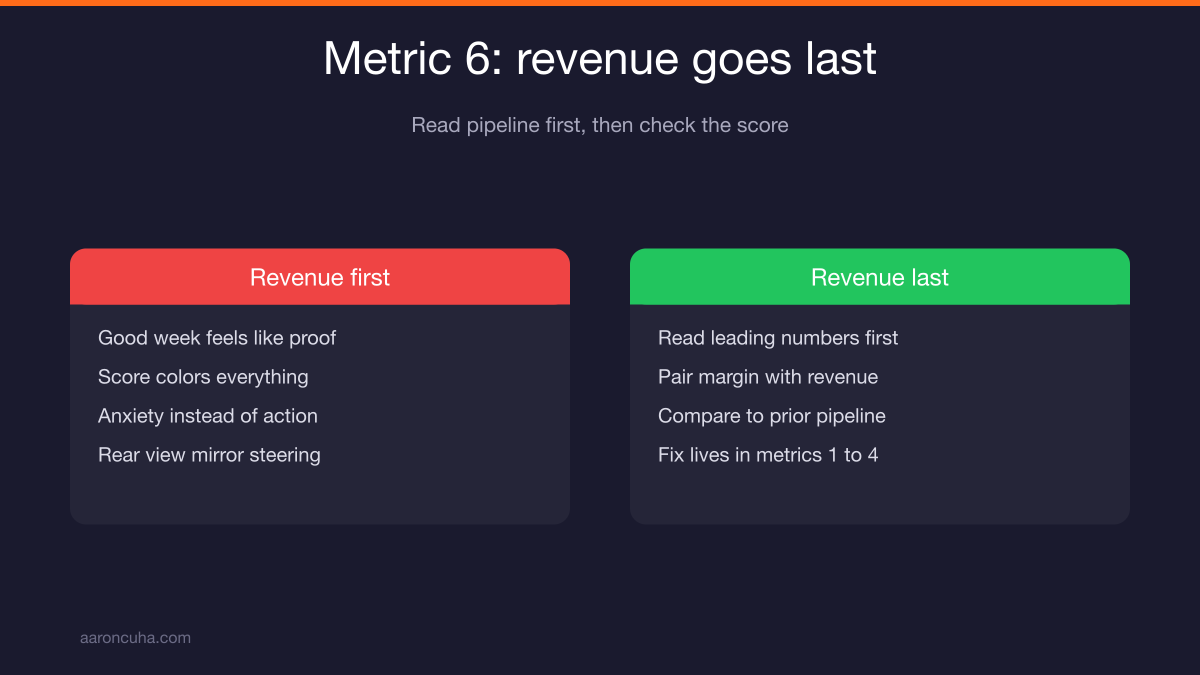
Read it in bands:
- Under 60 percent: you have room. Push sales hard.
- 60 to 80 percent: healthy. Keep selling, start recruiting.
- 80 to 90 percent: hire now or raise price now. Do not wait.
- Over 90 percent: quality is already slipping. You just cannot see it yet.
At DirectLender, growth outran the systems that supported it. Scale exposes every weak process at the same time.
The action at 80 percent is one of three moves: hire, delegate, or raise price. Raising price is the fastest and the one owners avoid longest.
If your capacity number is stuck because everything routes through you, the fix is structural. Start with how to delegate as an entrepreneur and then look at AI systems that absorb repetitive delivery work.
Want help turning these six numbers into a live dashboard for your business? Book a 90 minute strategy session and we will build your Monday page together.
Number 5: Cash Days on Hand
Cash in the bank divided by average daily operating expense. This is the number I did not respect enough, and it is the number that ends companies.
Profit is an opinion. Cash is a fact. A profitable business with no cash closes on a Tuesday.
The calculation takes two minutes. Take your total monthly operating expense, divide by 30 to get daily burn. Divide your available cash by that daily burn. That is your days on hand.
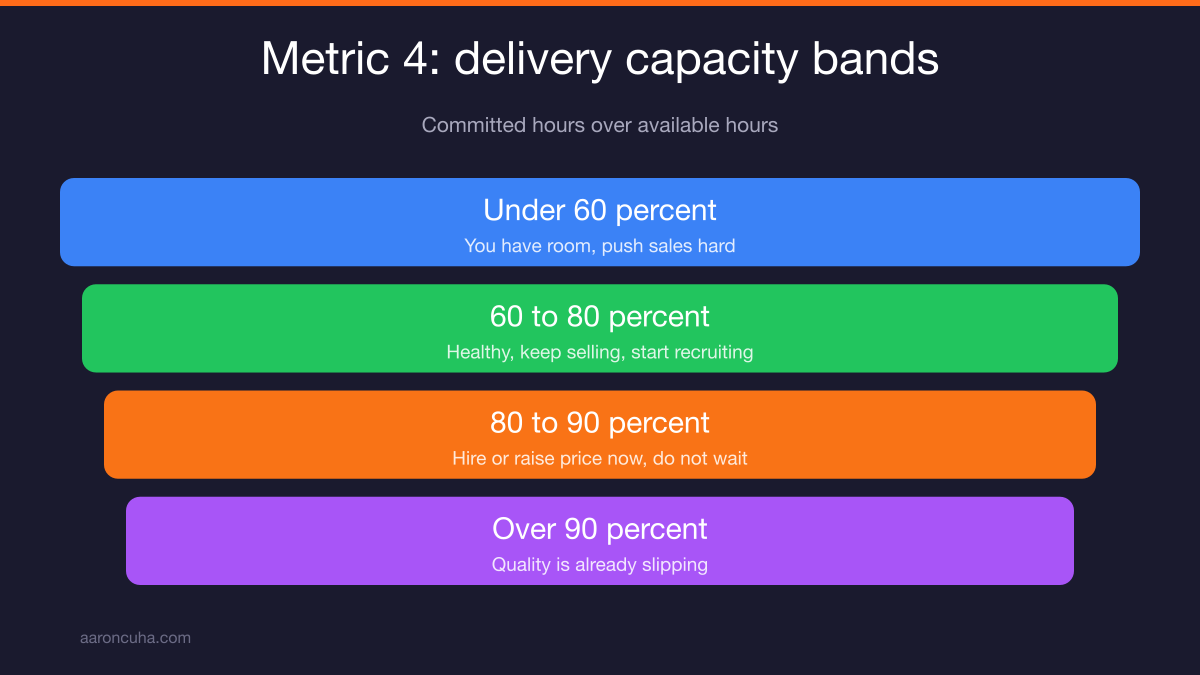
Set your bands in advance:
- Over 180 days: you can invest and take swings.
- 90 to 180 days: normal operating range for most businesses.
- 60 to 90 days: caution. Freeze new fixed costs.
- Under 60 days: execute the cut list. No debate.
The cut list is the part almost nobody builds. Write it now, while things are fine. List every expense in order of what goes first, second, third. Name the exact subscriptions, contracts, and commitments.
When cash gets tight, you will not think clearly. You will negotiate with yourself. A written list removes the negotiation.
I learned that at the worst possible cost. In 2008 the whole market moved at once, and companies without runway did not get time to adapt. The Federal Reserve publishes ongoing data on credit conditions, and the lesson holds in any cycle: access to capital tightens fastest exactly when you need it most.
Check cash days on hand every single Monday. Not monthly. Weekly.
Number 6: Lagging Revenue and Margin
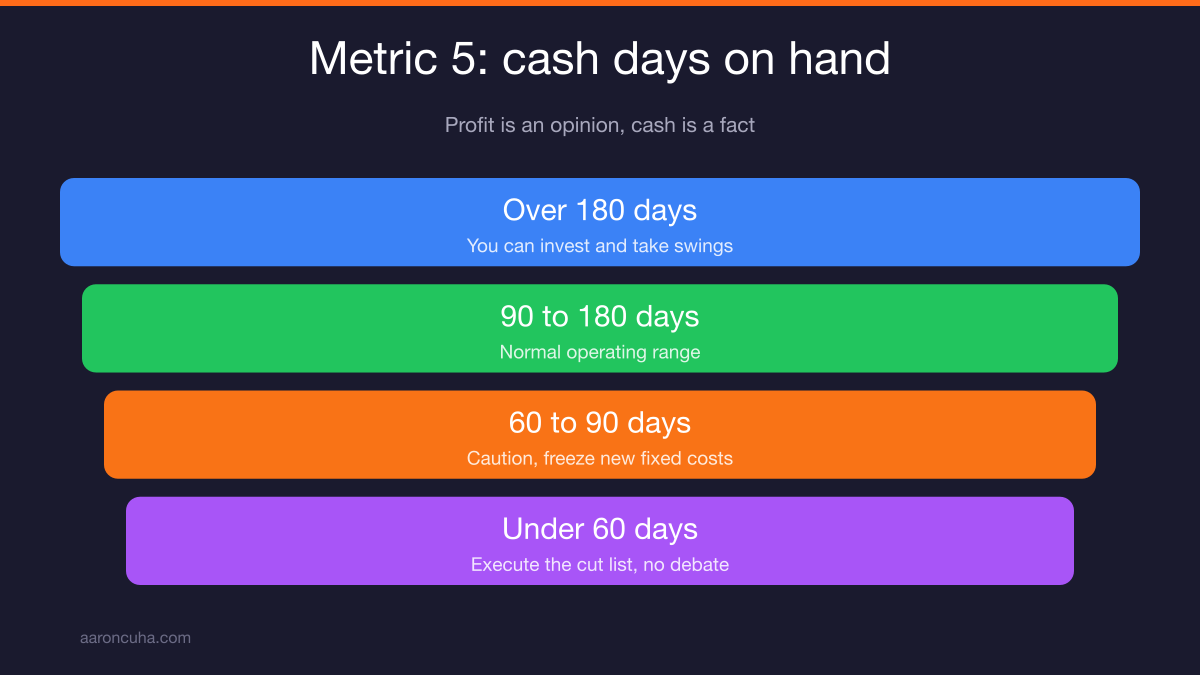
Revenue goes last on the page. It is a score, not a steering wheel. Read it against pipeline from prior periods to see whether your machine is working.
Most owners put revenue first, and it wrecks their judgment. A great revenue week feels like proof everything is fine. It is proof that something you did months ago worked.
Track revenue with margin beside it, always. Revenue up with margin down means you are buying growth. That is a choice, but make it on purpose.
The useful read is the comparison. Take this month's revenue and compare it against pipeline created one sales cycle ago. If pipeline was strong and revenue is weak, you have a conversion or delivery problem. If pipeline was weak and revenue is strong, enjoy it and get to work, because the drop is coming.
The action: revenue almost never triggers its own fix. When revenue is off, the fix lives in numbers one through four. Revenue just tells you to go look.
That is why it sits at the bottom of the page. You read the leading indicators first, form a view, then check the score. Reverse that order and the score colors everything you see.
Thresholds and Triggers: Turning Numbers Into Moves
Every metric needs three things attached: a cadence, a threshold, and a default action. Without those, you are just looking at numbers and hoping.
Here is the full dashboard in one table. Copy it.
| Metric | Cadence | Threshold Logic | Default Action |
|---|---|---|---|
| Pipeline created | Weekly | 4 week rolling average below target | Two week demand sprint |
| Conversion by stage | Weekly | Any stage down 3 weeks running | Audit last 10 lost deals in that stage |
| Cost to acquire | Monthly | Rising 2 months with flat conversion | Shift spend to owned media |
| Delivery capacity | Weekly | Above 80 percent committed | Hire, delegate, or raise price |
| Cash days on hand | Weekly | Below 90 days | Freeze costs, run the cut list |
| Revenue and margin | Weekly | Off plan versus prior pipeline | Diagnose in metrics 1 through 4 |
One more rule: every metric gets one named owner. Not a department. A person.
The owner pulls the number, reports it, and proposes the action. If you are a solo operator, you own all six, but write your name next to each one anyway. It changes how you treat them.
Shared ownership means no ownership. I watched that play out across 280 offices.
The Fifteen Minute Monday Review, Step by Step
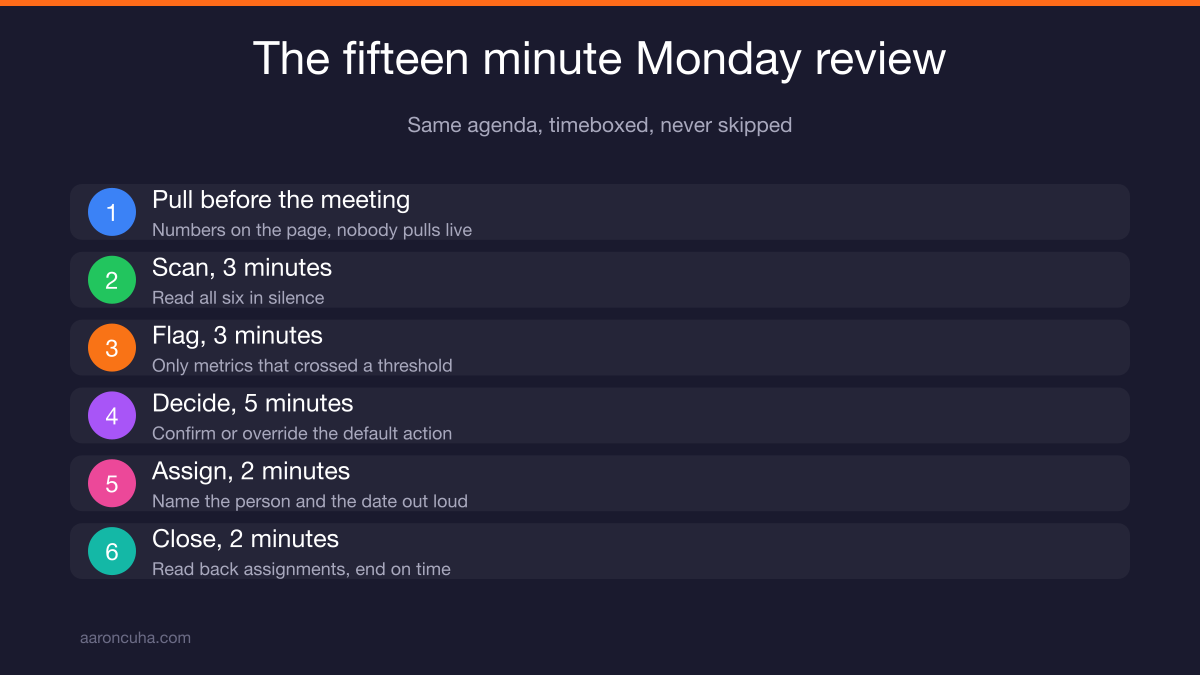
Run the same six step agenda every Monday, timeboxed to fifteen minutes. The consistency matters more than the depth. A shallow review you never miss beats a deep one you skip.
Here is the agenda:
- Pull (before the meeting, 0 minutes). Numbers are on the page before anyone sits down. Nobody pulls data live.
- Scan (3 minutes). Read all six top to bottom in silence. No commentary yet.
- Flag (3 minutes). Call out only metrics that crossed a threshold. Green numbers get no discussion time.
- Decide (5 minutes). For each flagged metric, confirm the default action or override it with a reason.
- Assign (2 minutes). Name the person and the date. Say both out loud.
- Close (2 minutes). Read back the assignments. End on time even if something feels unresolved.
What to skip: explanations. When a number is bad, the instinct is to justify it. Justification eats the whole meeting and produces nothing.
If a metric needs real analysis, that becomes an assigned task with its own meeting. The Monday review decides. It does not investigate.
Running solo? Same agenda, same clock, out loud or written. Write the flagged items and assignments in the same document each week. Reading last week's assignments before you start is the accountability.
The Harvard Business Review archive has strong material on meeting design if you want to go deeper on running tight recurring reviews.
Build Your One Page Business Dashboard Metrics Sheet This Week
Build it in a spreadsheet in seven days. Manual pulls first. Automate only after the habit sticks, because automating a habit you do not have yet is just procrastination with extra steps.
Here is the seven day plan:
- Day 1. Open a spreadsheet. Six rows, one per metric. Columns for this week, last week, four week average, threshold, owner.
- Day 2. Define qualified pipeline in writing. One sentence. Get your team to agree.
- Day 3. Map your sales stages and count where your last twenty deals sit or died.
- Day 4. Calculate cost to acquire, including your own hours at a real rate.
- Day 5. Count committed delivery hours against available hours for the next thirty days.
- Day 6. Calculate cash days on hand and write your cut list in priority order.
- Day 7. Set thresholds and default actions for all six. Put a recurring Monday block on the calendar.
Now the mistakes that kill this. I have watched all four.
Mistake one: adding a seventh metric. Then an eighth. Within two months you have a report nobody reads. Guard the six.
Mistake two: chasing perfect data. An approximate number reviewed weekly beats a perfect number reviewed never. Estimate and move.
Mistake three: skipping green weeks. When everything looks fine, the meeting feels pointless and you cancel it. Then you miss the week it stops being fine. Run it anyway. It takes fifteen minutes.
Mistake four: no pre-written actions. Without them, a bad number produces anxiety instead of movement. Write the actions on a calm day.
This dashboard is one piece of a larger operating system. The same logic applies to how you produce content, how you handle delivery, and how you decide what to automate. I laid out the broader approach in content systems for entrepreneurs and in AI business systems that run without constant supervision.
The lesson from 2008 was not that I lacked data. I had more data than most companies will ever have. I lacked a short list of numbers with thresholds attached, reviewed on a fixed day, owned by a named person.
Six numbers. One page. Fifteen minutes. That is the whole system.
If you want structure and accountability while you build it, join the Systems Over Hustle community and get the weekly review rhythm running alongside owners doing the same work.
Frequently Asked Questions

Written by
Aaron CuhaAuthor of Crazy Simple YouTube, keynote speaker, and executive coach with 20,000+ hours logged. ICF PCC, NLP Master Practitioner, and DISC Certified. Aaron helps entrepreneurs replace hustle with AI-powered systems that generate leads, content, and revenue on autopilot.